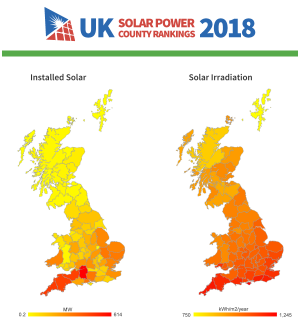
As summer sees Britain breaking record after record for solar power generation, new research, compiled by Green Business Watch, ranks the UK’s solar performance on a county-by-county basis for the first time.
With the growing public demand for sustainable builds, the UK Solar Power County Rankings provide an unprecedented amount of information about UK Solar energy in one place, allowing property owners to see the real benefits of solar in their area.
As the potential savings and income from solar PV installations vary across the country, residents and businesses can for the first time use the map to identify the potential savings and income they could achieve by investing in solar PV.
UK Solar Power County Rankings 2018

Not surprisingly, the rankings show Southern counties leading the way but they also highlight a number of areas that are not making the most out of their solar resource.
Some Key Findings:
- Solar irradiation across the South of England is uniformly strong but counties such as East Sussex, West Sussex and Surrey seem to be missing out, and have installed less solar capacity than might have been expected.
- Wiltshire, which ranks number one for installed capacity is neither the sunniest nor the largest of Britain’s counties. Despite being outside the top 10 for solar irradiation, large volumes of commercial solar see Wiltshire top the rankings and hint at opportunities that some other counties are perhaps missing out on.
- Estimates of domestic income / savings varied from £413 in Shetland to £655 in the Isle of Wight but excluding the extremes of the Islands, differences in solar irradiation and potential earnings are probably smaller than imagined. As an example, sample locations in Angus (Scotland) had a predicted income/savings figure of £538 per year. This was less than southern English counties such as Bedfordshire (£561 per year) but the gap is only £23 per year.
- Norfolk, Lincolnshire and Nottinghamshire are all surprise finds in the top 10 and Northern English counties such as Yorkshire and Greater Manchester make surprise showings in the top 10 for domestic capacity.
Overall, the UK Solar Power County Rankings paint a picture of solar uptake in the UK that is much more patchy than the opportunity, with some counties outperforming their solar potential while others aren’t yet taking advantage of the available resource.
Alastair Kay, Editor at Green Business Watch said:
“Solar energy presents an opportunity for property owners across the UK but there is a lot of uncertainty over what the benefits are in real terms and what the figures really mean for householders.”
“If we as an industry are to keep solar growing, it’s essential that we help property owners to see what can be achieved using solar. We’ve put together the UK Solar Power County Rankings to give a complete picture comparing solar deployment and potential on a county by county basis.”
The UK Solar Power County Rankings allow us for the first time to see where our county ranks and how the opportunity and the take up compared with other counties around the country.
You can view the full rankings at:
https://greenbusinesswatch.co.uk/uk-solar-power-county-rankings
The Key Findings and various visualisations (which you are welcome to use or adapt) are at:
